The IoT Solution Draft
Overview
The IoT Solution Draft is used for analyzing a prototype or minimum viable product for an interesting IoT idea. The draft is shown in the figure below and can be discussed starting from various angles. At the bottom left you find the thing, which might be the most obvious starting point for technical inclined readers. You usually have a thing in focus when talking about IoT, haven't you? Well, if you've managed to read the somehow hidden subsection in our book on "Adding some structure" (see online version), the possible inception points to capture and control the "real world" are not the only starting points.
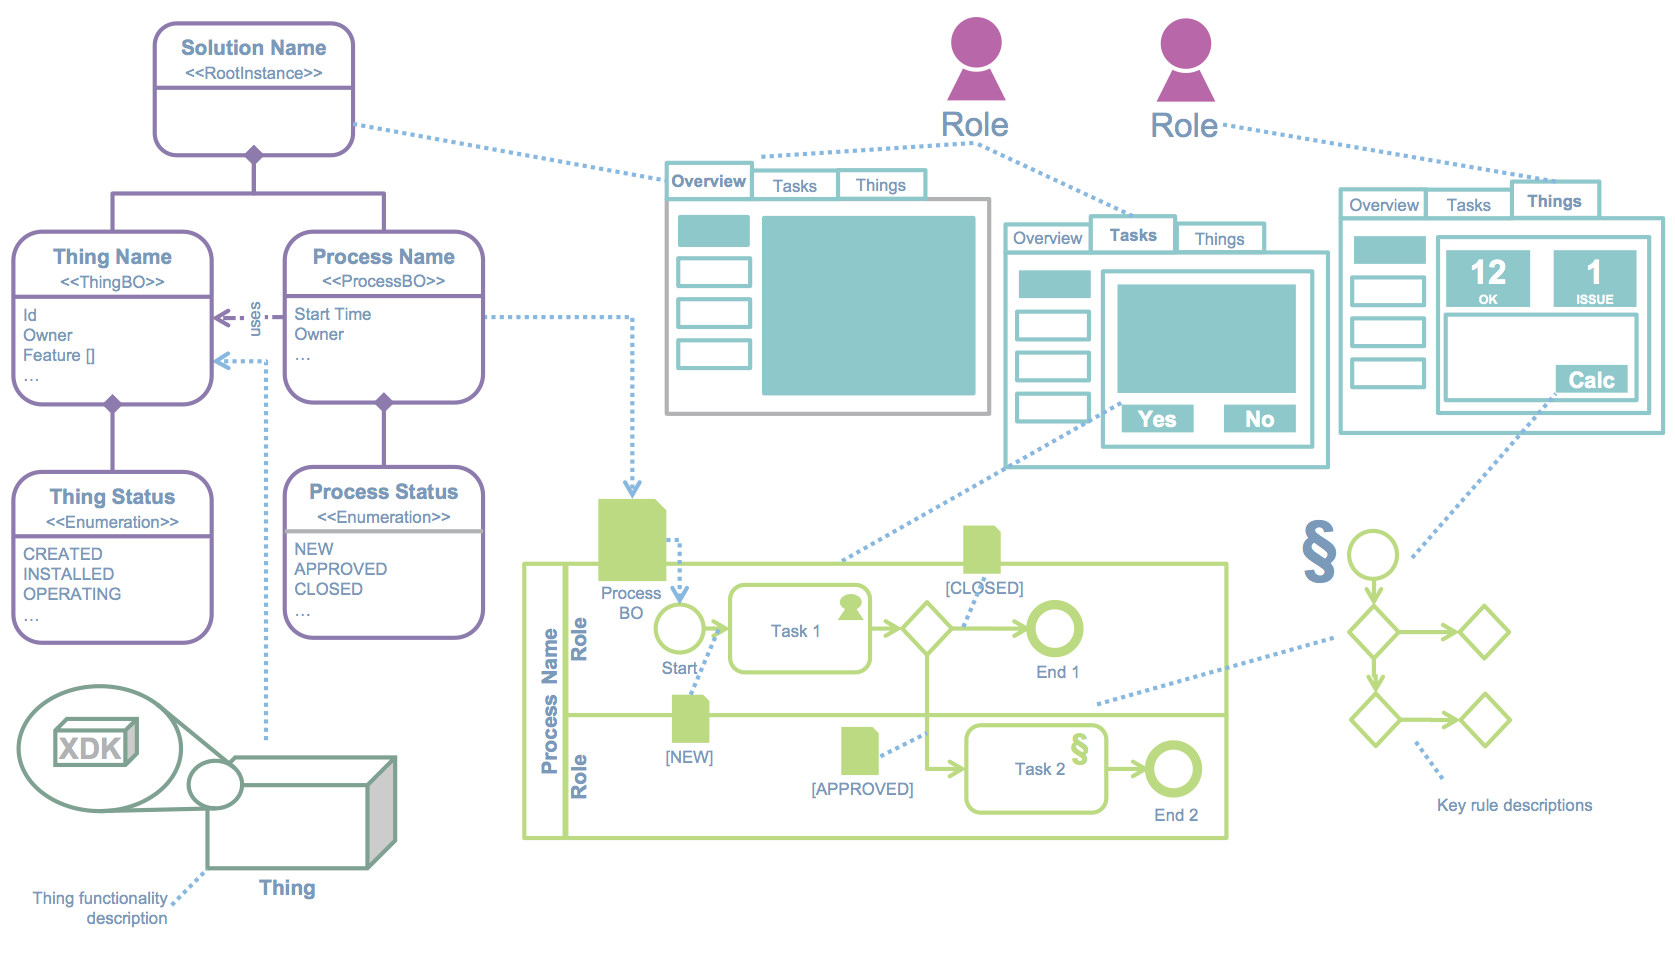
Hold on for a second and think about your business requirements, your stakeholders? What would they like to see? Given, in Silicon Valley, the VC people might look out for your next cool thing (aka device/asset) where they might dump their money on. Almost anywhere else, however, IoT is people centric as everything else. Hence, that is why we depicted the key stakeholders (roles) right on top. What do these people trying to achieve? Maybe one is a manager and just wants a quick overview how his business is doing? Another one might be a technician, who has a task list to work on and take a look at details of specific assets? Turns out, the key UIs are also quite important.
Of course, the users of the system usually don't just click around in the user interfaces. They have to follow operational processes and guidelines, which describe how the business is run. We capture those as business process and rules. The ability to quickly update or change them is critical for the IoT business to stay at the competitive edge. Some people (like I) see this as the crucial point. There is even the term "IoTS" - The Internet of Things and Services. Being able to align the business stakeholders with the service offerings is key.
While talking about business: The missing key artifact is the so called Domain Model, depicted in a reduced UML class diagram. In contrast to class diagrams used in software engineering, these class diagrams depict the key business objects (BOs), regardless how or where they are stored. We use specific stereotypes ("markers") like Process or Thing BO. The former denotes a business object used primarily within a business process (case/instance data) whereas the latter depicts a logical representation of a thing. Both are used, of course, in the user interfaces as shown by the dotted lines.
Before we dive into the details of each diagram type, the question arises: Where to start? As always, there is not the one forward answer. Typical best practices suggest starting with either the domain model or the stakeholders/user interfaces. There is also nothing wrong to start with processes/rules or the things if that is what matters most to your customer. The template shown is a kind of mind map for you to remember what other information you need to capture together with the customer and how those are interlinked.
This article gives a short introduction into the IoT Solution Draft. Please find the corresponding slides here. We also wrote a draft conference paper on the IoT Solution Methodology, which can be found here.
Stakeholder & Roles
One of the first stakeholder exercises that you should start with is a stakeholder quadrant, shown in the figure below. We did actually display the quadrants as circles to be able to show the relations between. But let's start step-by-step.

In the upper left corner we depict the users of the solution. In a fictive rental car company, this could be the end users, e.g. customers renting a car, the employees of the company (clerks, accounting, etc.), or both. Let's use the employees as the running example throughout this introduction.
The users, in this case the clerks and accounting staff, work with remotely connected assets (to be shown in the bottom left corner), in our case cars. We should depict a very high-level use case, e.g. capturing the driving behavior (harsh accelerations, crash, etc.), in this box.
The upper right box contains the key services of the company that are supported by the solution. Who is interested in creating advanced or new services based on IoT? You should depict the roles as well as the expectations, e.g. the head of operations would like to provide a special rate based on the driving behavior of the clients. To achieve this, there need to be relations between the solution users as well as the connected assets.
Finally, we use the partner ecosystem to capture external parties that we work together with. This might be insurance companies, to whom we might give direct access to our cars (then depicted with an arrow between partners and assets).
There is one more thing worth mentioning: In the beginning we talked about things, but right now we have assets and devices. Confusing? Not really, but just a bit more detailing. We use the word "thing" to depict the concept of anything that can be connected, either physical or virtual. An "asset" (as defined in Enterprise IoT) is a thing of value for a company, i.e. something a company keeps in its books, like the cars a rental company owns. An assets then can have multiple "devices" attached that collect data, act on something, or process and transmit the data.
Once you are done with the quadrants, more traditional use case analysis for the users (including the ones working on the enterprise services as well as partners) should be done. We propose to start with UML use case diagrams, depicted below for our car rental example. Further refinements should be done in more elaborate tabular ways, e.g. as described in „Writing Effective Use Cases“ by Alistar Cockburn.
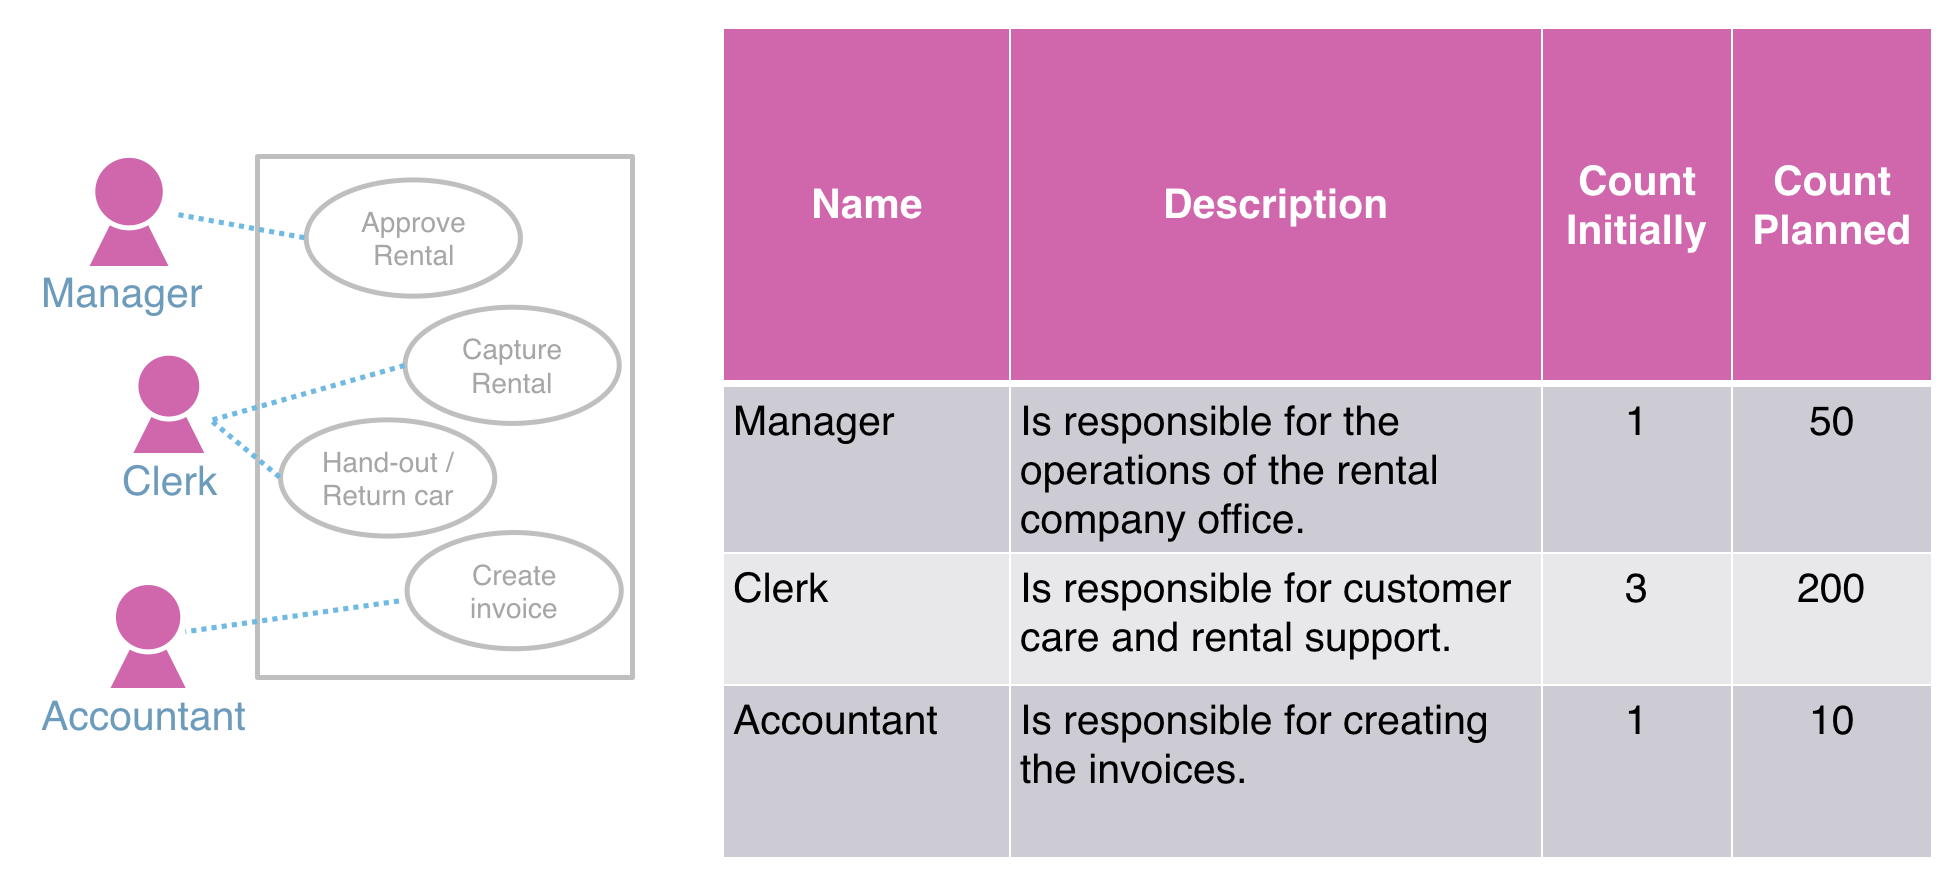
While talking about tables, one that you need to discuss early on with your customer's project manager relates not only to the roles using the system but also the estimated counts - for the initial PoC and later stages. This information is important to design how your solution needs to scale. While our example only brings smaller numbers to the table, this might change if we add a self-service app for the rental customers. Since we don't plan this for the sake of simplicity, we even omit the rental customer from the table. We will do a more fine grained analysis later on, including a look at how often the managers, clerks, etc. use the system in a day.
Domain Model
We already mentioned the "Domain Model". While we primary use this model to create a conceptual view of the solution at hand from a business point of view, the model also is the single source of truth that brings together all the other models. You have a field in your UI mockup? Let's see the class that contains the attribute for the field. Your thing is sending a status update? Show me the attribute in the domain model! The car rental manager needs to approve a rental above a certain value? This value should be found in the domain model - I guess you've got it by now.
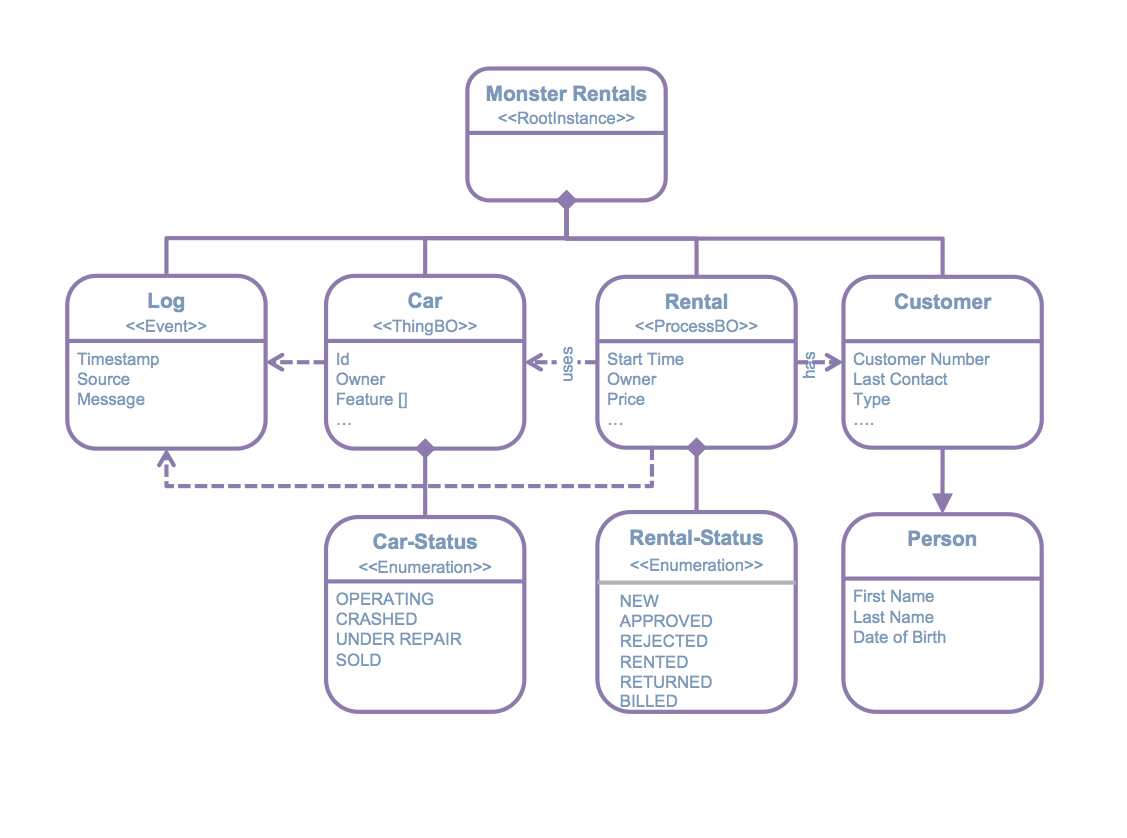
We have some additional thoughts anyhow. First of all, please use boxes, state the name of the entity in the center on top and draw a line before listing the attributes. We don't care so much about technical details like data types, cardinalities, etc. (remember: business focus) but you should use the four stereotypes (the "markers") below the name of the entity if one of the conditions below matches:
ProcessBO: Represents a business object that is routed through a process. Imagine it like a folder containing anything related to processes. In our rental company, this is the rental process object containing details like the start time or the price.
ThingBO: A business object representing a thing, e.g. a car in our example.
Event: An event that might occur during the execution of a process or directly come from a thing. It is usually used as some kind of log.
Enumeration: An enumeration is primary used to capture the different states of a thing or process business object (more on this in the next section) but can also be used for simple enumerations like the available colors or car types.
Of course, you can also use plain classes for additional entities like the customer. Also, sometimes concepts like inheritance make sense, as shown in the person/customer relation.
Talking about relations, there are two more things to use: Simple associations, e.g. linking the car to the log, and aggregations. All aggregations should start from a single entity marked as root instance that is used as the starting point for referring anything in the domain model. Hence, any domain model must contain exactly one root instance entity, usually named after the solution.
To refer to any entity in the domain model, we use a simple arrow/dot notation starting from any entity directly aggregated by the root instance denoted as path expressions. Examples:
Rental.StartTime refers to the start time of any rental; can be filtered like Rental.StartTime=Today (feel free to go as formal as you require)
Rental->Customer refers to any Customer
There is a special use case, where you don't need to filter your entities but you already refer to a specific instance: ProcessBO entities used in a business process or role. We will discuss this later when we talk about business processes and rules.
Lifecycles
One specific stereotype deserves a closer look, since it will link the static nature of the domain model entities with behavior, i.e. how they develop over time. The specific stereotype is an enumeration, which needs to be attached to any Process or Thing business object but can also be attached to any other entity.
If you take a closer look at the figure below, you can find a refined version of the Car-Status entity. The status of a car that we are interested in can be any of purchased, operating, crashed, under repair or sold. The status of a thing or process is usually of high interest to the business stakeholders.
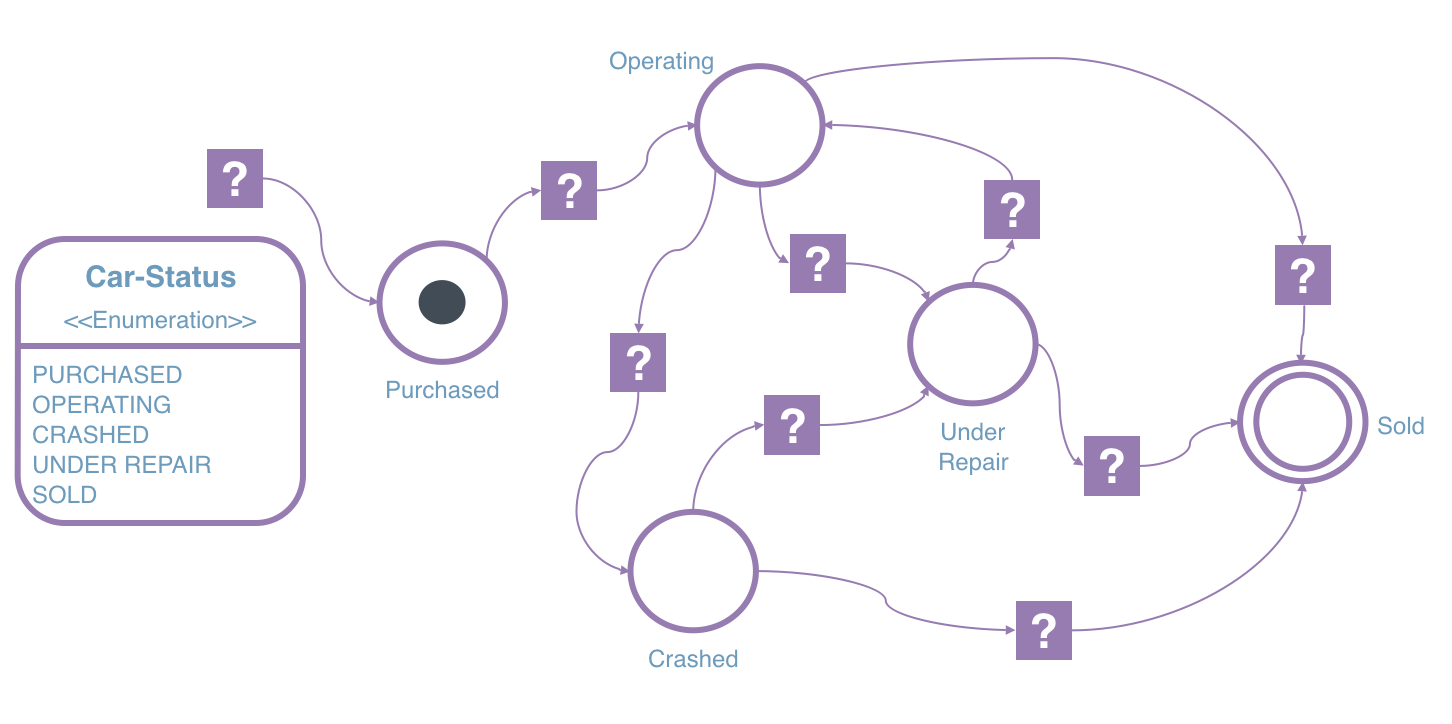
To get started, we need to define - from a pure logical business view - how the states evolve. You can ideally discuss this directly with the business stakeholders in a workshop. First, place all discussed states on a whiteboard shown as circles with the corresponding name of the state next to each circle. The circles should exactly resemble the names found in the enumeration.
Next, we need to discuss with the business stakeholders what is the initial and what are the final states. There should be just one initial state (like a car is purchased) and one or more final states after which no other states can be reached (like if a car is sold, we cannot do anything anymore with it). We denote the final states with a double-lined outline.
Finally - and most important - we need to discuss which state can be reached from which other one(s), denoted as state transitions. We simply draw in lines with an arrow heading from the source to the target state. You can also denote how or when a state transition should occur (e.g. sensor detects a crash moves the car's state from operating to crashed). Take a closer look at the Car-Status example above to understand the idea.
Finally, you should play the token game with your customer to validate the created lifecycle diagram. Therefore, you simply place a token, shown as a solid circle (or ideally a magnet if drawn on a whiteboard), to the initial state. Then go through a fictive scenario with your customer like the car is operating, crashed, repaired, etc. Each time you move the token to the recent state the entity is in. While doing this, you need to ensure that the token is always free to move and only gets stuck in a final state. Reconsider the states as well as the transitions if required.
Processes
After having defined the lifecycles of the ProcessBO entities, we should model the complete business processes managing them. In general, we can distinguish two different types of implementing ProcessBO lifecycles via business processes: (1) processes are the only mean to achieve state transitions of business objects (must) or (2) processes are a recommended way of how state transitions of business objects are handled (should). The former type is usually denoted as process-driven (see BPM Intro) whereas the latter one as case-driven (see Production Case Management).
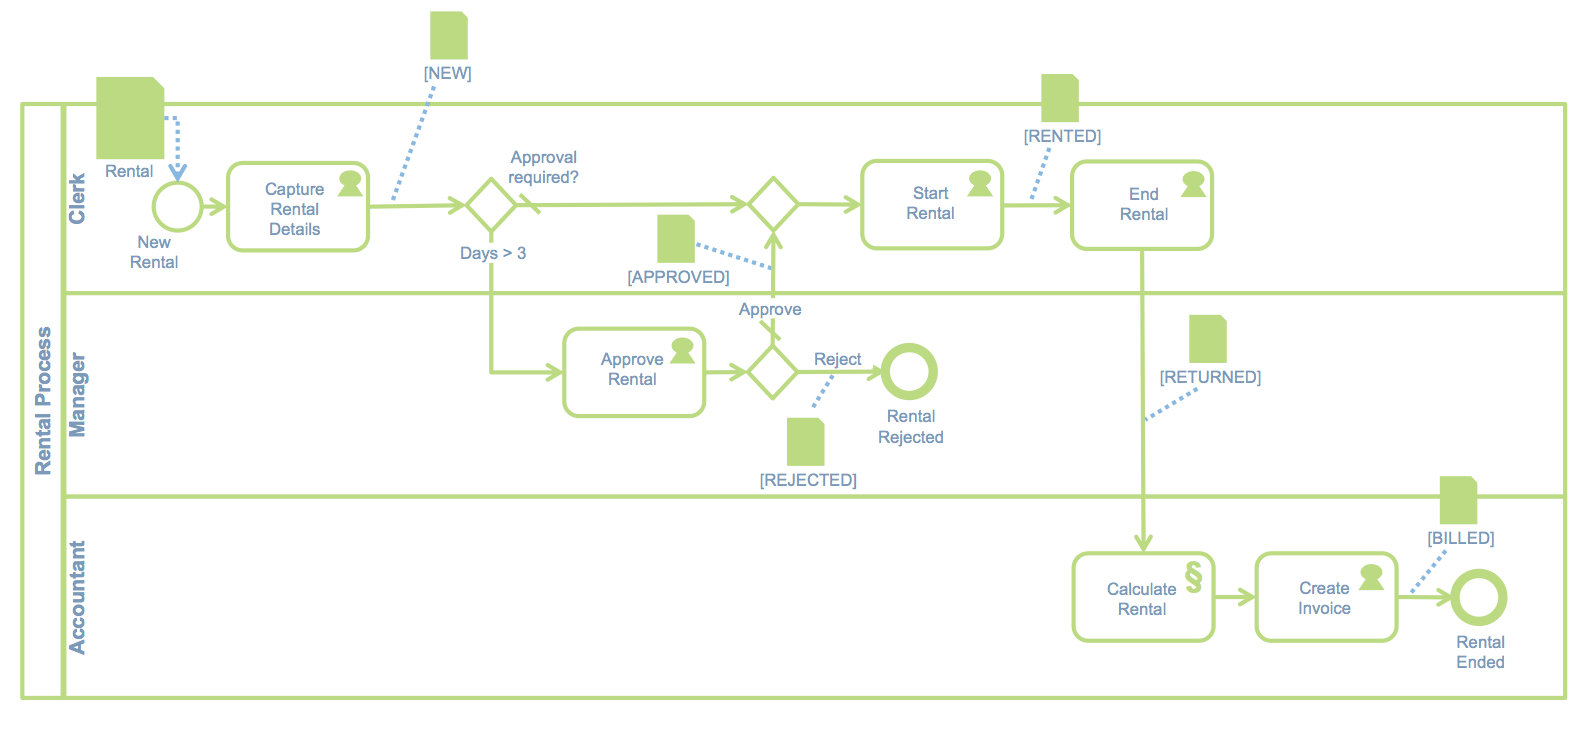
Business processes usually capture at least three different task types: (1) Human Tasks - a task performed by a human via a fronted; (2) Service Tasks - A task performed by a system; and (3) Rule Tasks - A calculation done by a rule engine. The world-standard for modeling business processes is the Business Process Model & Notation standard (short BPMN), as described by the OMG in the BPMN 2.0 Specification. A good overview is available online as a BPMN 2.0 poster.
An example of how to map the different lifecycle states of the ProcessBO to the business process diagram is shown in the figure above: To see which ProcessBO(s) are used, they are linked with the initial start event. If the completion/execution of an activity node or decision changes the lifecycle state, this is denoted at the outgoing sequence flows of this node. Please iterate over your lifecycle model to see that the process only contains state transitions for the lifecycle states that are captured in the lifecycle model. If the process contains more behavior, discuss why you haven’t captured it right in the lifecycle model before or adapt the process. If the lifecycle model allows for more behavior, this basically fine. You just need to make sure to include the logic and user interface to support those transitions outside of the process implementation.
Rules
While business processes are stateful and usually long running, business rules describe functional business logic and should be stateless. As business processes, business rules work on business objects. More recently, the OMG also standardized a notation for business rules, the Decision Model & Notation (short DMN, see DMN Specification). Since the DMN has not yet gained the traction that BPMN has in the acceptance and tool support, we typically recommend a simpler subset: (1) Tree-based rules; e.g. if-then-else style and (2) Tabular rules; e.g. Excel-style. Both styles are shown in the figure below.

A tree-based rule takes an entity from the domain model as an input. Decisions are denoted as diamonds, with the operation given by a path expression (see Domain Model section). A tree-based role is also used to orchestrate the tabular rules, like the calculation of the discount in the example. The table defines how input parameters (like Rental->Customer.Type) are mapped to an output parameter (e.g. Rental.Price).
In general, business rules are used to make processes more flexible, since they have an independent lifecycle from the process (usually more easy to change and adapt). They also help in centralizing and re-using business logic in different processes or other parts of the application.
User Interfaces
A lot of material on user interfaces (UIs) can be found in the Web and I don’t want to claim to have a specific hand for it. I just want to give you some technical hints on how to map user interfaces with the artifacts shown before and refresh some core principles: Create your user interfaces with a simple, repeating structure of core building blocks that can be easily arranged according to responsive layouts:
Use Black/White schematics: A good user interface visualizes everything required if mapped to just two colors
Keep it simple: Think twice if you need each element you have in mind first
Focus on functionality: Each element should have a clearly defined function that is the same where ever it appears
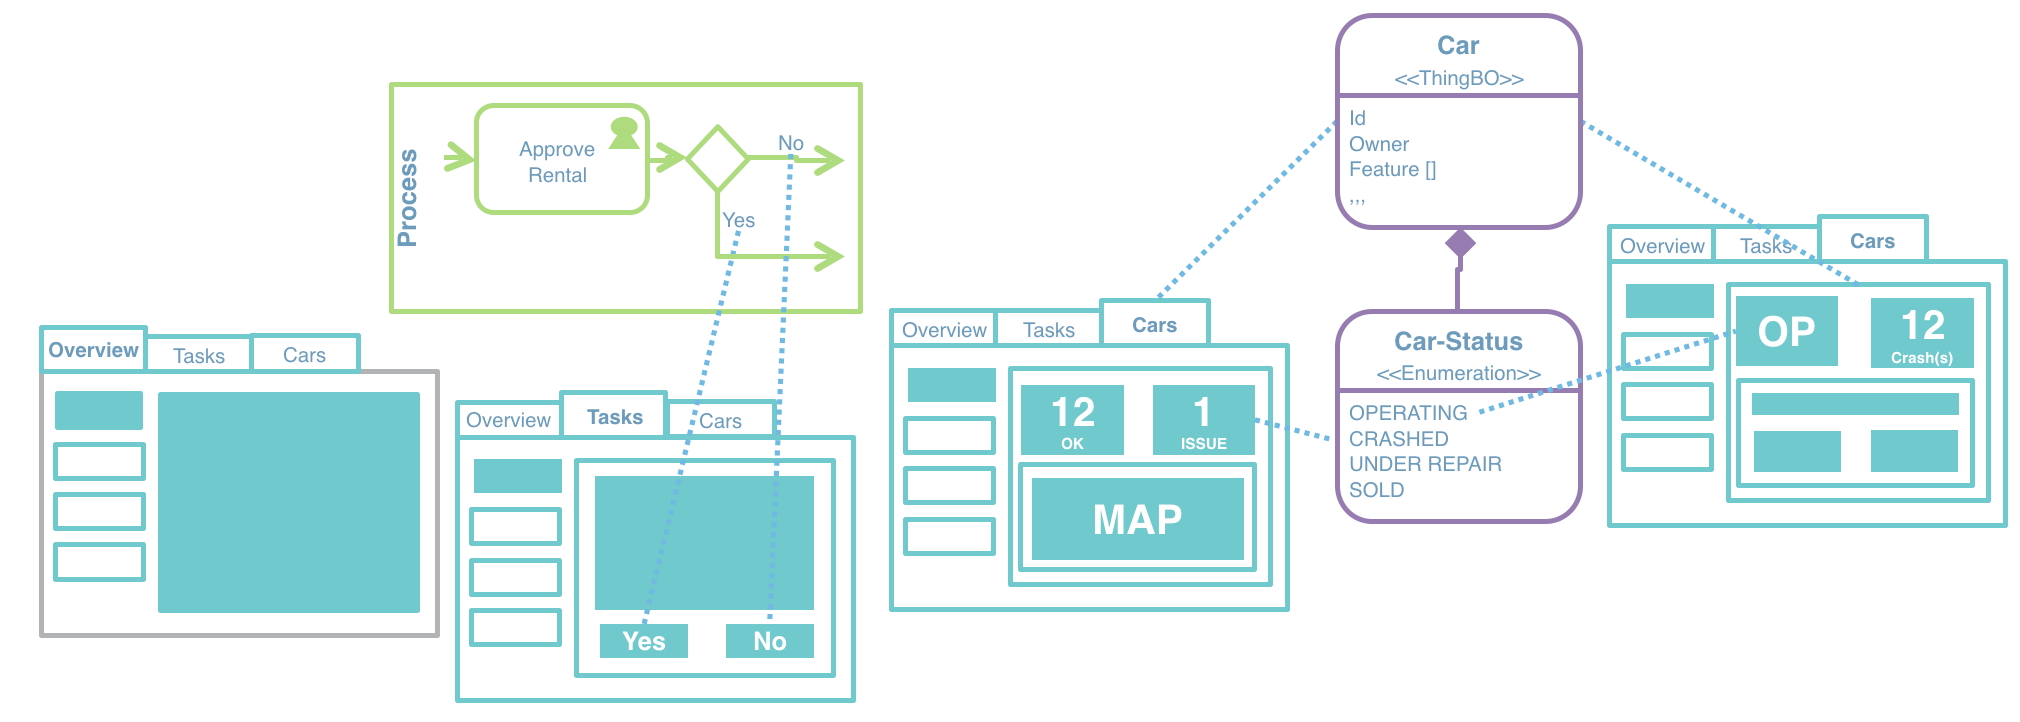
The figure above shows how to link user interfaces with processes and entities from the domain model. Each human task of a process where a decision is made must be reflected by corresponding buttons in the UI. You need to take care that the UI labels are the same as the labels used in the outgoing sequence flows of a decision gateway following the human task. For entities from the domain model, make sure that you make a clear distinction to differentiate between collections (like a list of cars) and a single entity (like the details of the car). Usually, you should show more details at the bottom of the UI and group it by functionality/features if required.
Connectivity
A core concept from the Ignite methodology of Enterprise IoT is the Asset Integration Architecture (abbr. AIA, see Functional Design). In contrast to the elements of the Solution Draft, the AIA already considers possible implementation details to provide a more technical documentation/discussion.
While we provide tons of different examples for the AIA throughout the book (we use at as a vehicle to illustrate and compare our case studies as well as lot of architectures), the core ideas are depicted in the figure below.
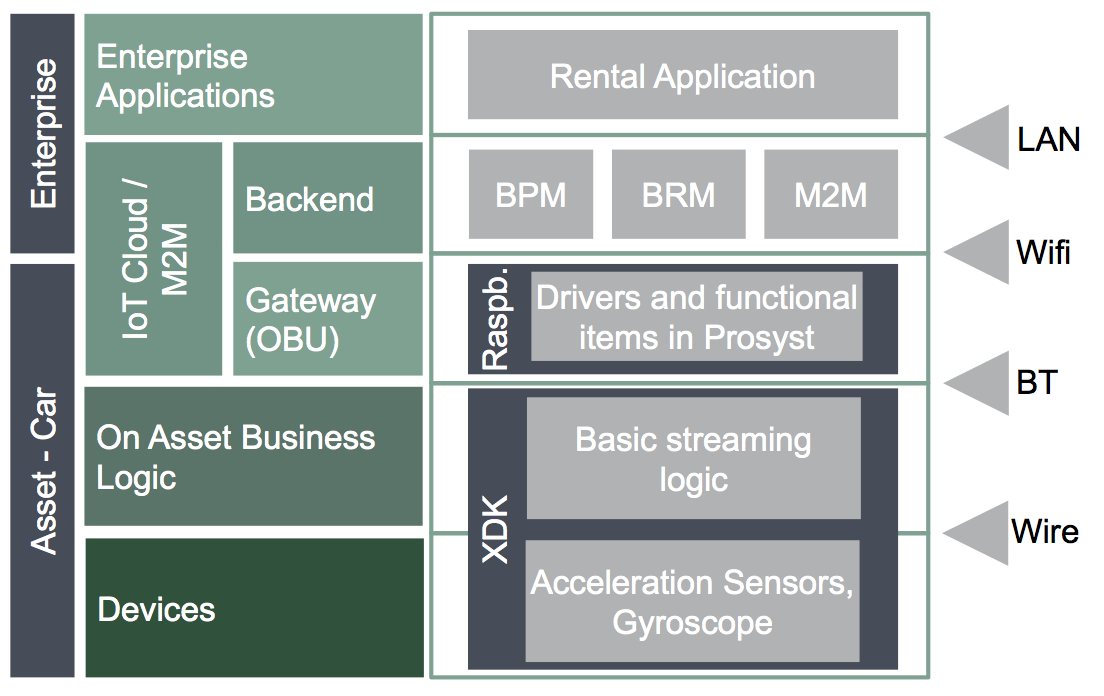
First of all, an AIA is split into two sections, the Asset and the Enterprise part. Which one is top, really depends on your customer: If the enterprise system world is the focus, this should be on top; otherwise the asset can be up. Our examples puts the enterprise first (without much intention). The core sub-elements are then the Enterprise Applications, the IoT or M2M Cloud, which might be split into a backend and gateway part. In the IoT world, a gateway is typically used to connect assets, which either (1) have no direct internet connectivity build in; e.g. simple door sensors etc. or (2) require local business logic if no internet connection is available; e.g. a car passing through a tunnel. The asset itself is composed of devices (sensors, actuators) and some core on asset business logic like the detection of an event that needs to send.
In our running example for the rental scenario, we use a Business Process Management system (BPM), a Business Rule Management component (BRM), as well as an M2M system. Since they are all running on backend servers, they are connected with a local area network (LAN). We use a Raspberry Pi for our demo scenario, which runs an M2M stack from Prosyst (link) that provides drivers and business logic (functional items) for our scenario. The Raspberry Pi is connected via Wifi with the backend and via Bluetooth with the on asset business logic. For prototyping, we use a Bosch XDK (http://xdk.bosch-connectivity.com) that provides sensors for acceleration as well as a gyroscope that we use to detect hard accelerations and crashes.
Project Sketch
To present the results of the analytics done earlier, we typically use a so called Project Sketch. A Project Sketch highlights the results on a single page in five different rows and is used as a decision template for an initial project approval (hence the name). The topmost row show the key stakeholders with the expected numbers for at least two different years or rollout stages. The second row highlights the key UIs that are required for the solution as well as links to the corresponding stakeholders.
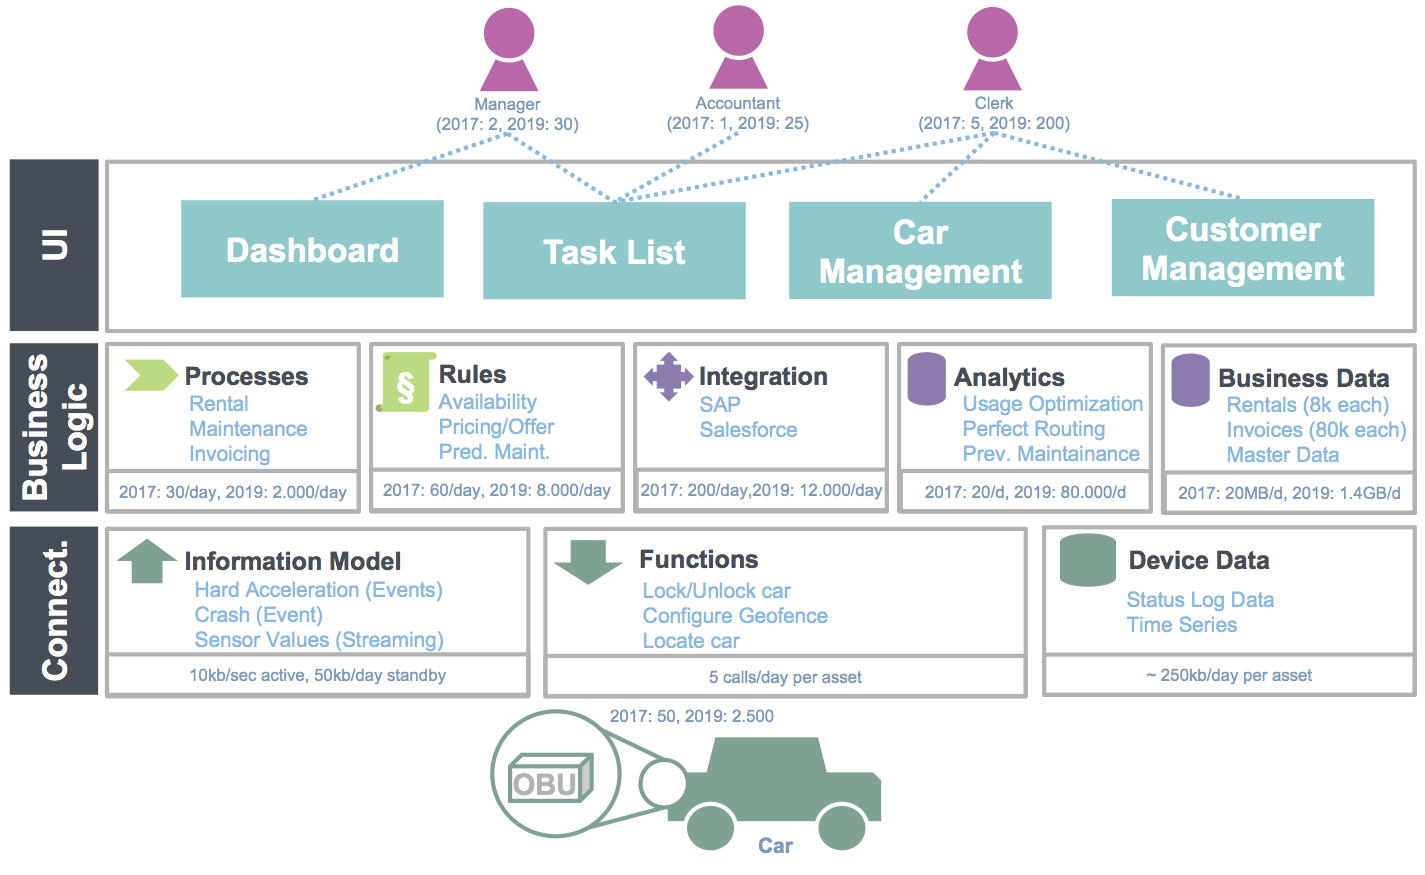
The third row, denoted as „Business Logic“ gets more complex. We usually divide it into five boxes, with the option to leave out the ones that are not required for a particular solution. Each box has a bottom line with the expected numbers just like the stakeholders. The first box is called „Processes“ and lists the top 3-5 business processes identified. The expected numbers are typically cumulated for the listed processes but one can also give an overall number if there are a lot more instances of different processes. The second box is denoted as „Rules“ and captures the top 3-5 business in the same way the processes are captured. The third box is called „Integration“ and captures the top external systems that we need to interact with. If they have not already been identified in the previous steps, now is the right time to add them. The numbers below show the expected system calls. A forth box, denoted as „Analytics“, captures the key business analytics queries. Since we have not introduced analytics before, we just leave it to the key stakeholders to define their business requirements at this step of the methodology. If we will later on use machine learning, complex event processing (CEP) or other technologies to implement the analytics are not important at this step. The final box of the third row is called „Business Data“. This box captures the—typically—structured data that is required at the business logic level. In many cases, this data is later on stored in a relational database (SQL).
The fourth row represents the results of the connectivity analysis. The „Information Model“ box describes the data coming from the assets, either aggregated (such as events) or streamed (e.g. for live values). The expected numbers are not shown by years, since this can be simply calculated by the expected asset counts from row five. Instead, depending on the asset, we make a distinction between active (e.g. streaming) and passive (e.g. sending only events) states. The information model is also represented as a part of the Domain Model (via the stereotype „ThingBO“). The „Functions“ box captures the key functions that should be invokable on the asset as well as the number of expected calls per day/asset. The final box, „Device Data“ stores the log data and time series data from the assets. This is typically handled by a No-SQL database to allow for easy adoption of the data coming from the assets.
The fifth and final row shows a visualisation of the asset, together with the expected numbers and means of communication. In our example, this is the „On Board Unit“ (short OBU) of a car.
The Project Sketch can also be used as an initial template, if no time or further information upfront is available. It is usually directly created together with key stakeholders like a product manager or corresponding functional heads. Typically, already the filling of the boxes introduced raises a number of questions that need to be further discussed by the customer. The Project Sketch hence helps providing initial awareness of the complexity of an IoT project.